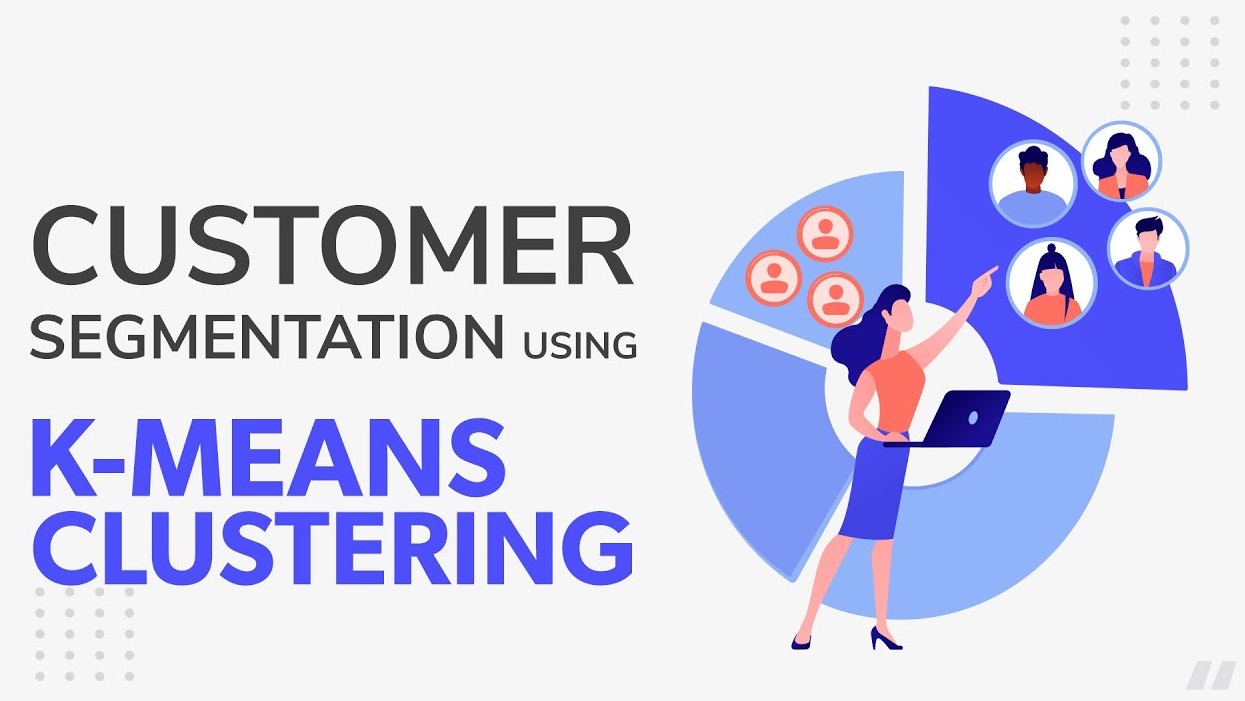
Customer Segmentation using K-Means Clustering
Python - Pandas & scikit-learn
This project is to perform customer segmentation utilizing RFM (Recency, Frequency, Monetary) analysis coupled with K-Means clustering. The process begins
with data preprocessing, where recency, frequency, and monetary metrics are curated from transactional data. Subsequently, the data undergoes
scaling and optimization for clustering through the elbow method, determining an optimal number of clusters (3 or 4). Following model training,
customers are segmented into three groups: 'Gold', 'Silver', and 'General', based on their RFM attributes. A user interaction feature allows for
querying customer IDs to discern their respective group memberships, facilitating targeted marketing strategies.
Learn more

Handwritten Digits Recognition Using KNN
Python - Pandas & scikit-learn
This project is done for classifying handwritten digits using the K-Nearest Neighbors (KNN) algorithm. Initially, the MNIST dataset is loaded and preprocessed,
including scaling and flattening of the images. Subsequently, a KNN classifier is trained on the flattened training data achieving an accuracy score of
97.05% on the test set. In the image recognition phase, an image of a handwritten digit is processed, resized, and fed into the trained model, successfully
predicting the digit as a '9'. Finally, the trained KNN model is saved for future use.
Learn more

Breast Cancer Detection using SVM
Python - Pandas & scikit-learn
Implemented Support Vector Machines (SVMs) algorith to classify breast cancer tumors using
the Breast Cancer Wisconsin (Diagnostic) dataset sourced from Kaggle. The dataset consists of various features characterizing tumors,
with diagnoses labeled as malignant (M) or benign (B). After preprocessing the data and splitting it into training and testing sets, an
SVM model with a linear kernel is trained, achieving an accuracy score of 95.91% on the test set. The model demonstrates its predictive
capability by correctly classifying a new tumor sample.
Learn more
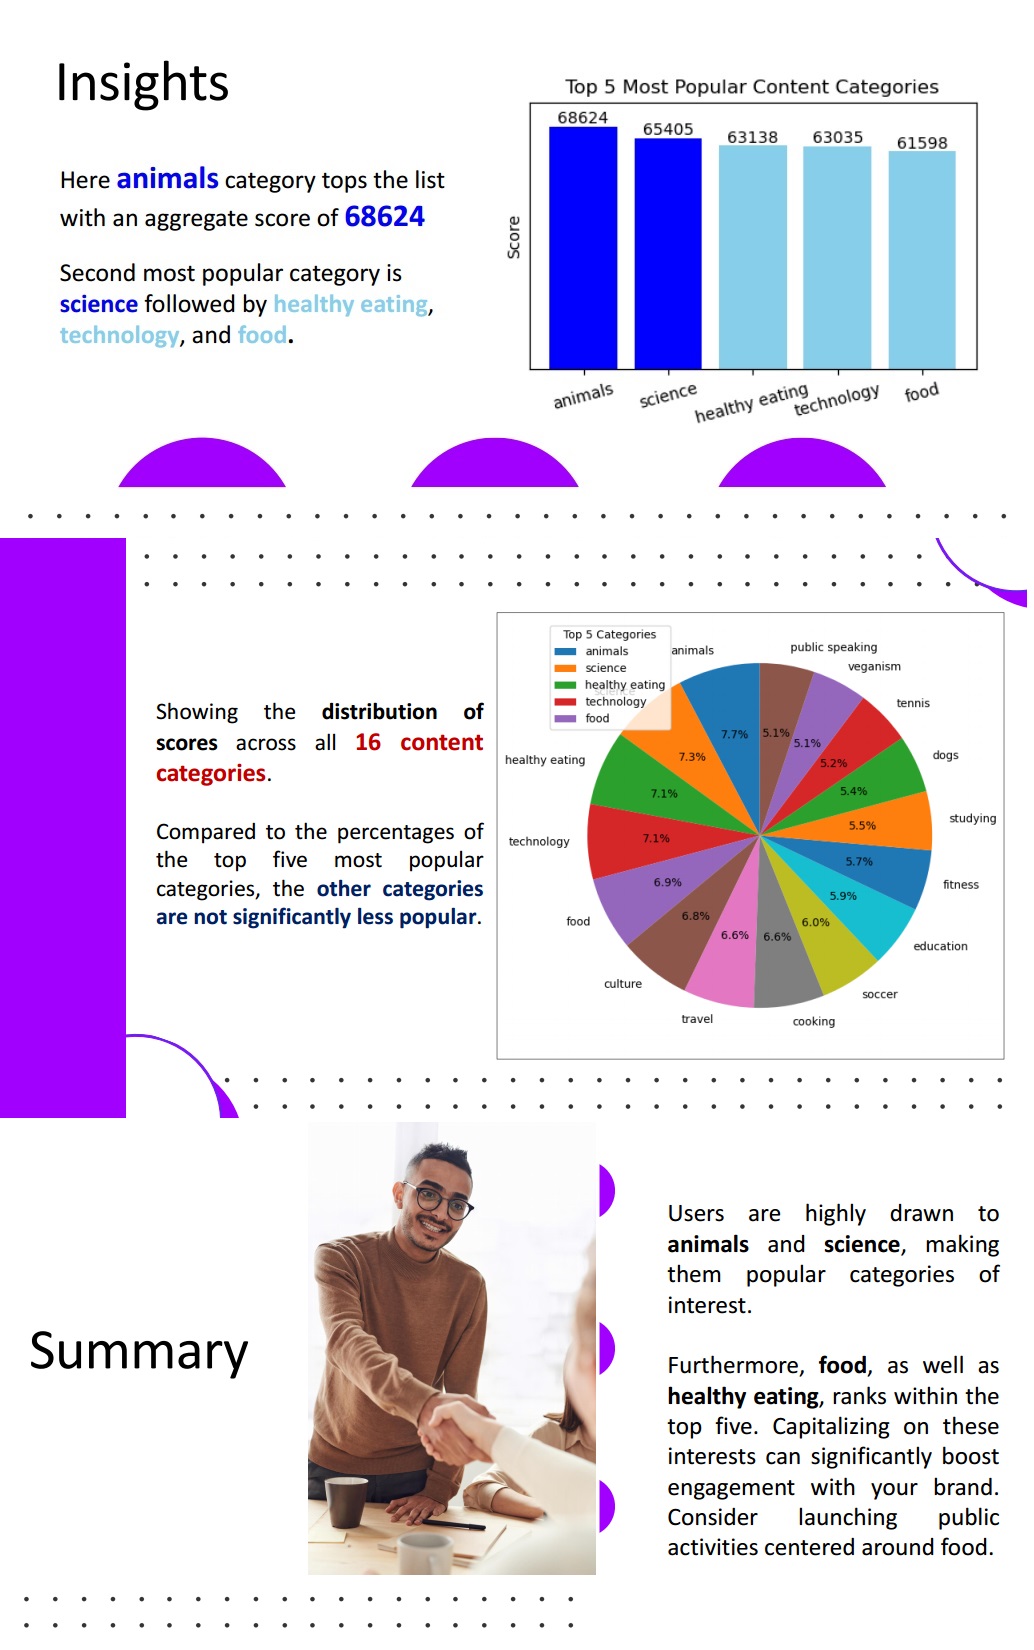
Social Media Content Analysis
Python - Pandas, Matplotlib & Seaborn
Analyzed Social Buzz client data, identifying top content categories as Data Analyst at Accenture (Job Simulation).
Data cleaning involved handling null values, adjusting data types, and removing duplicates.
Performed data manipulation, modeling, analusis, and visualization.
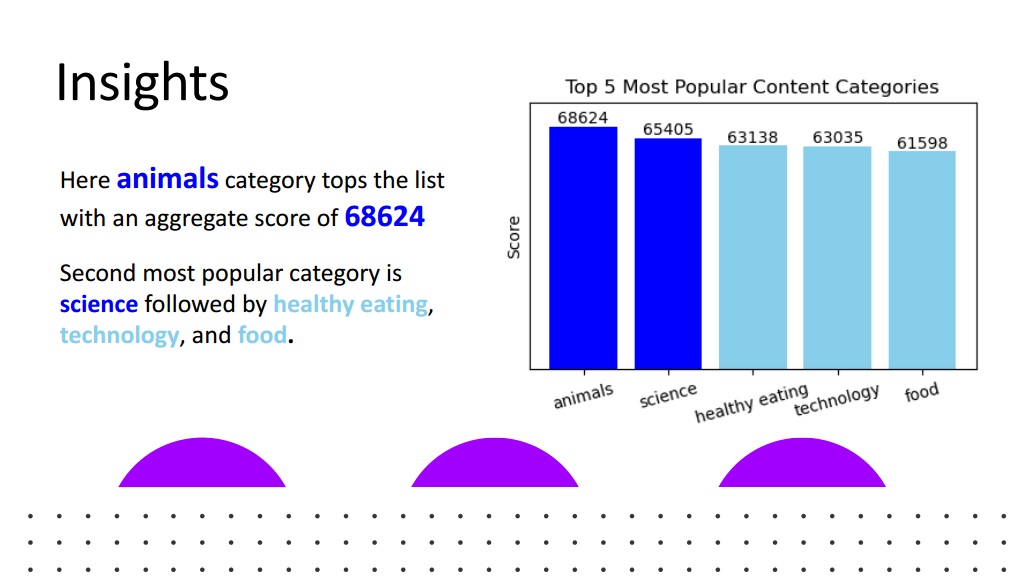
The final analysis identified the top 5 content categories, visualized through bar plots and
pie charts.
Learn more
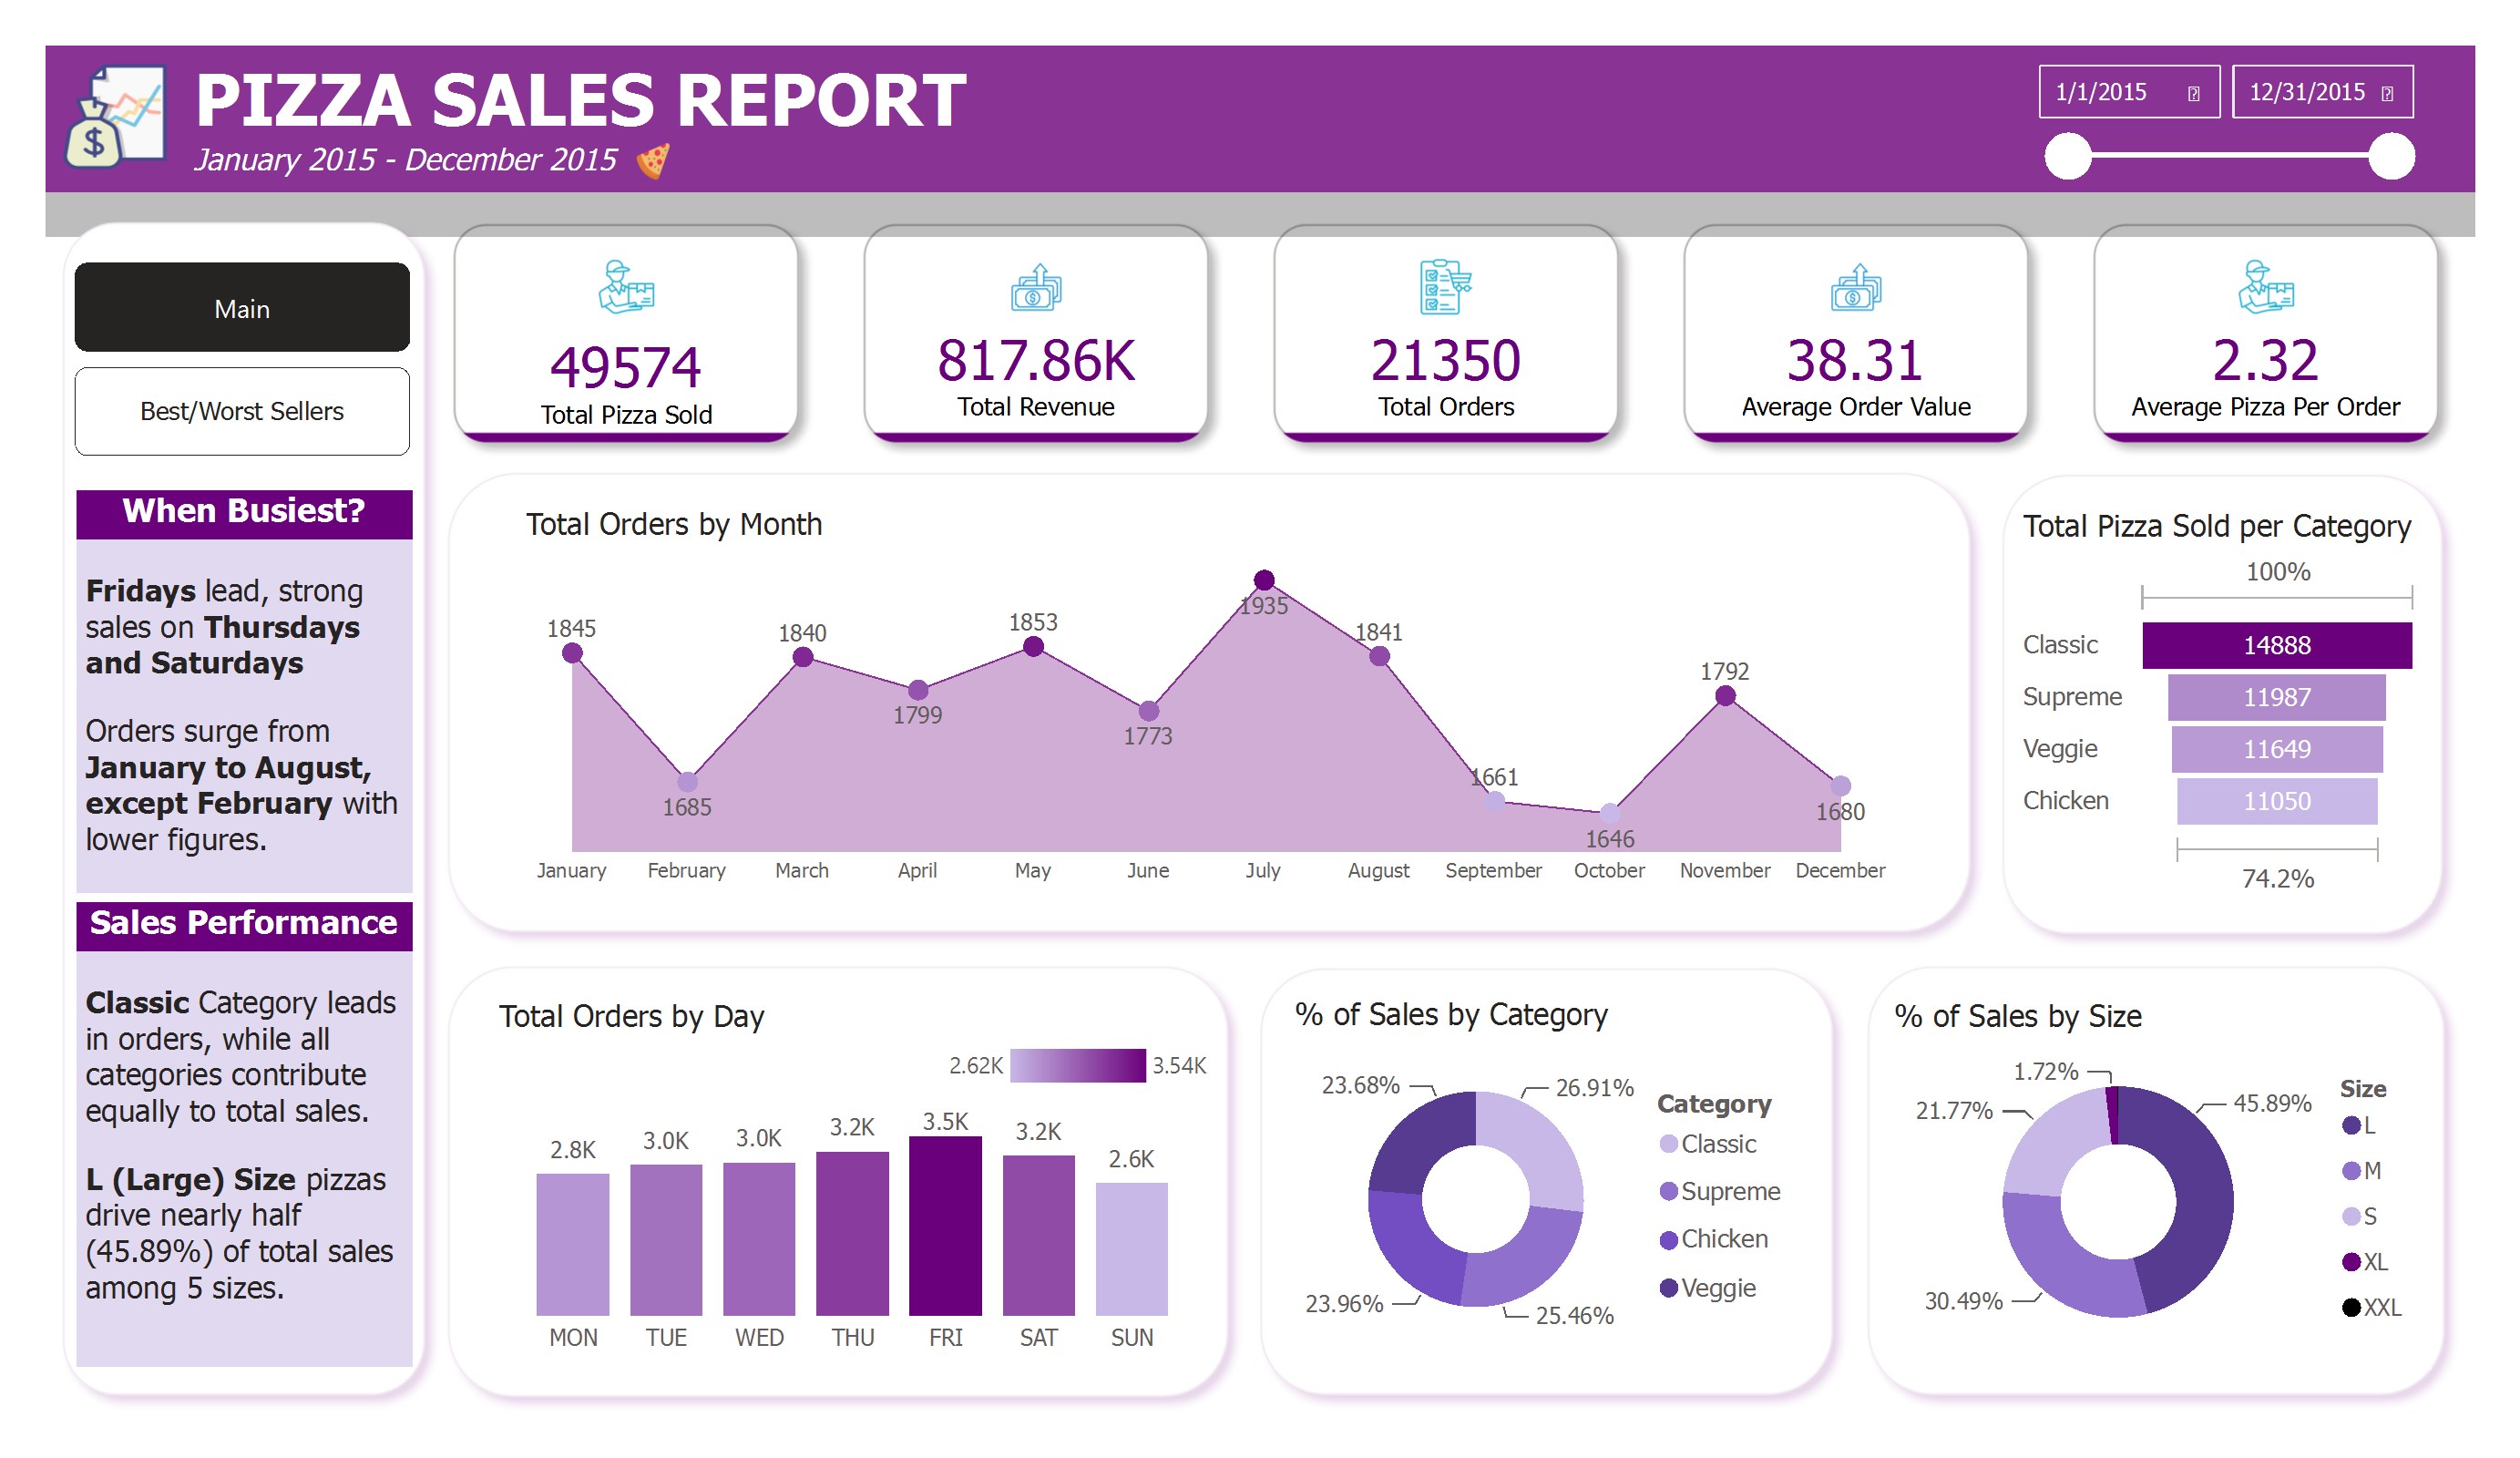
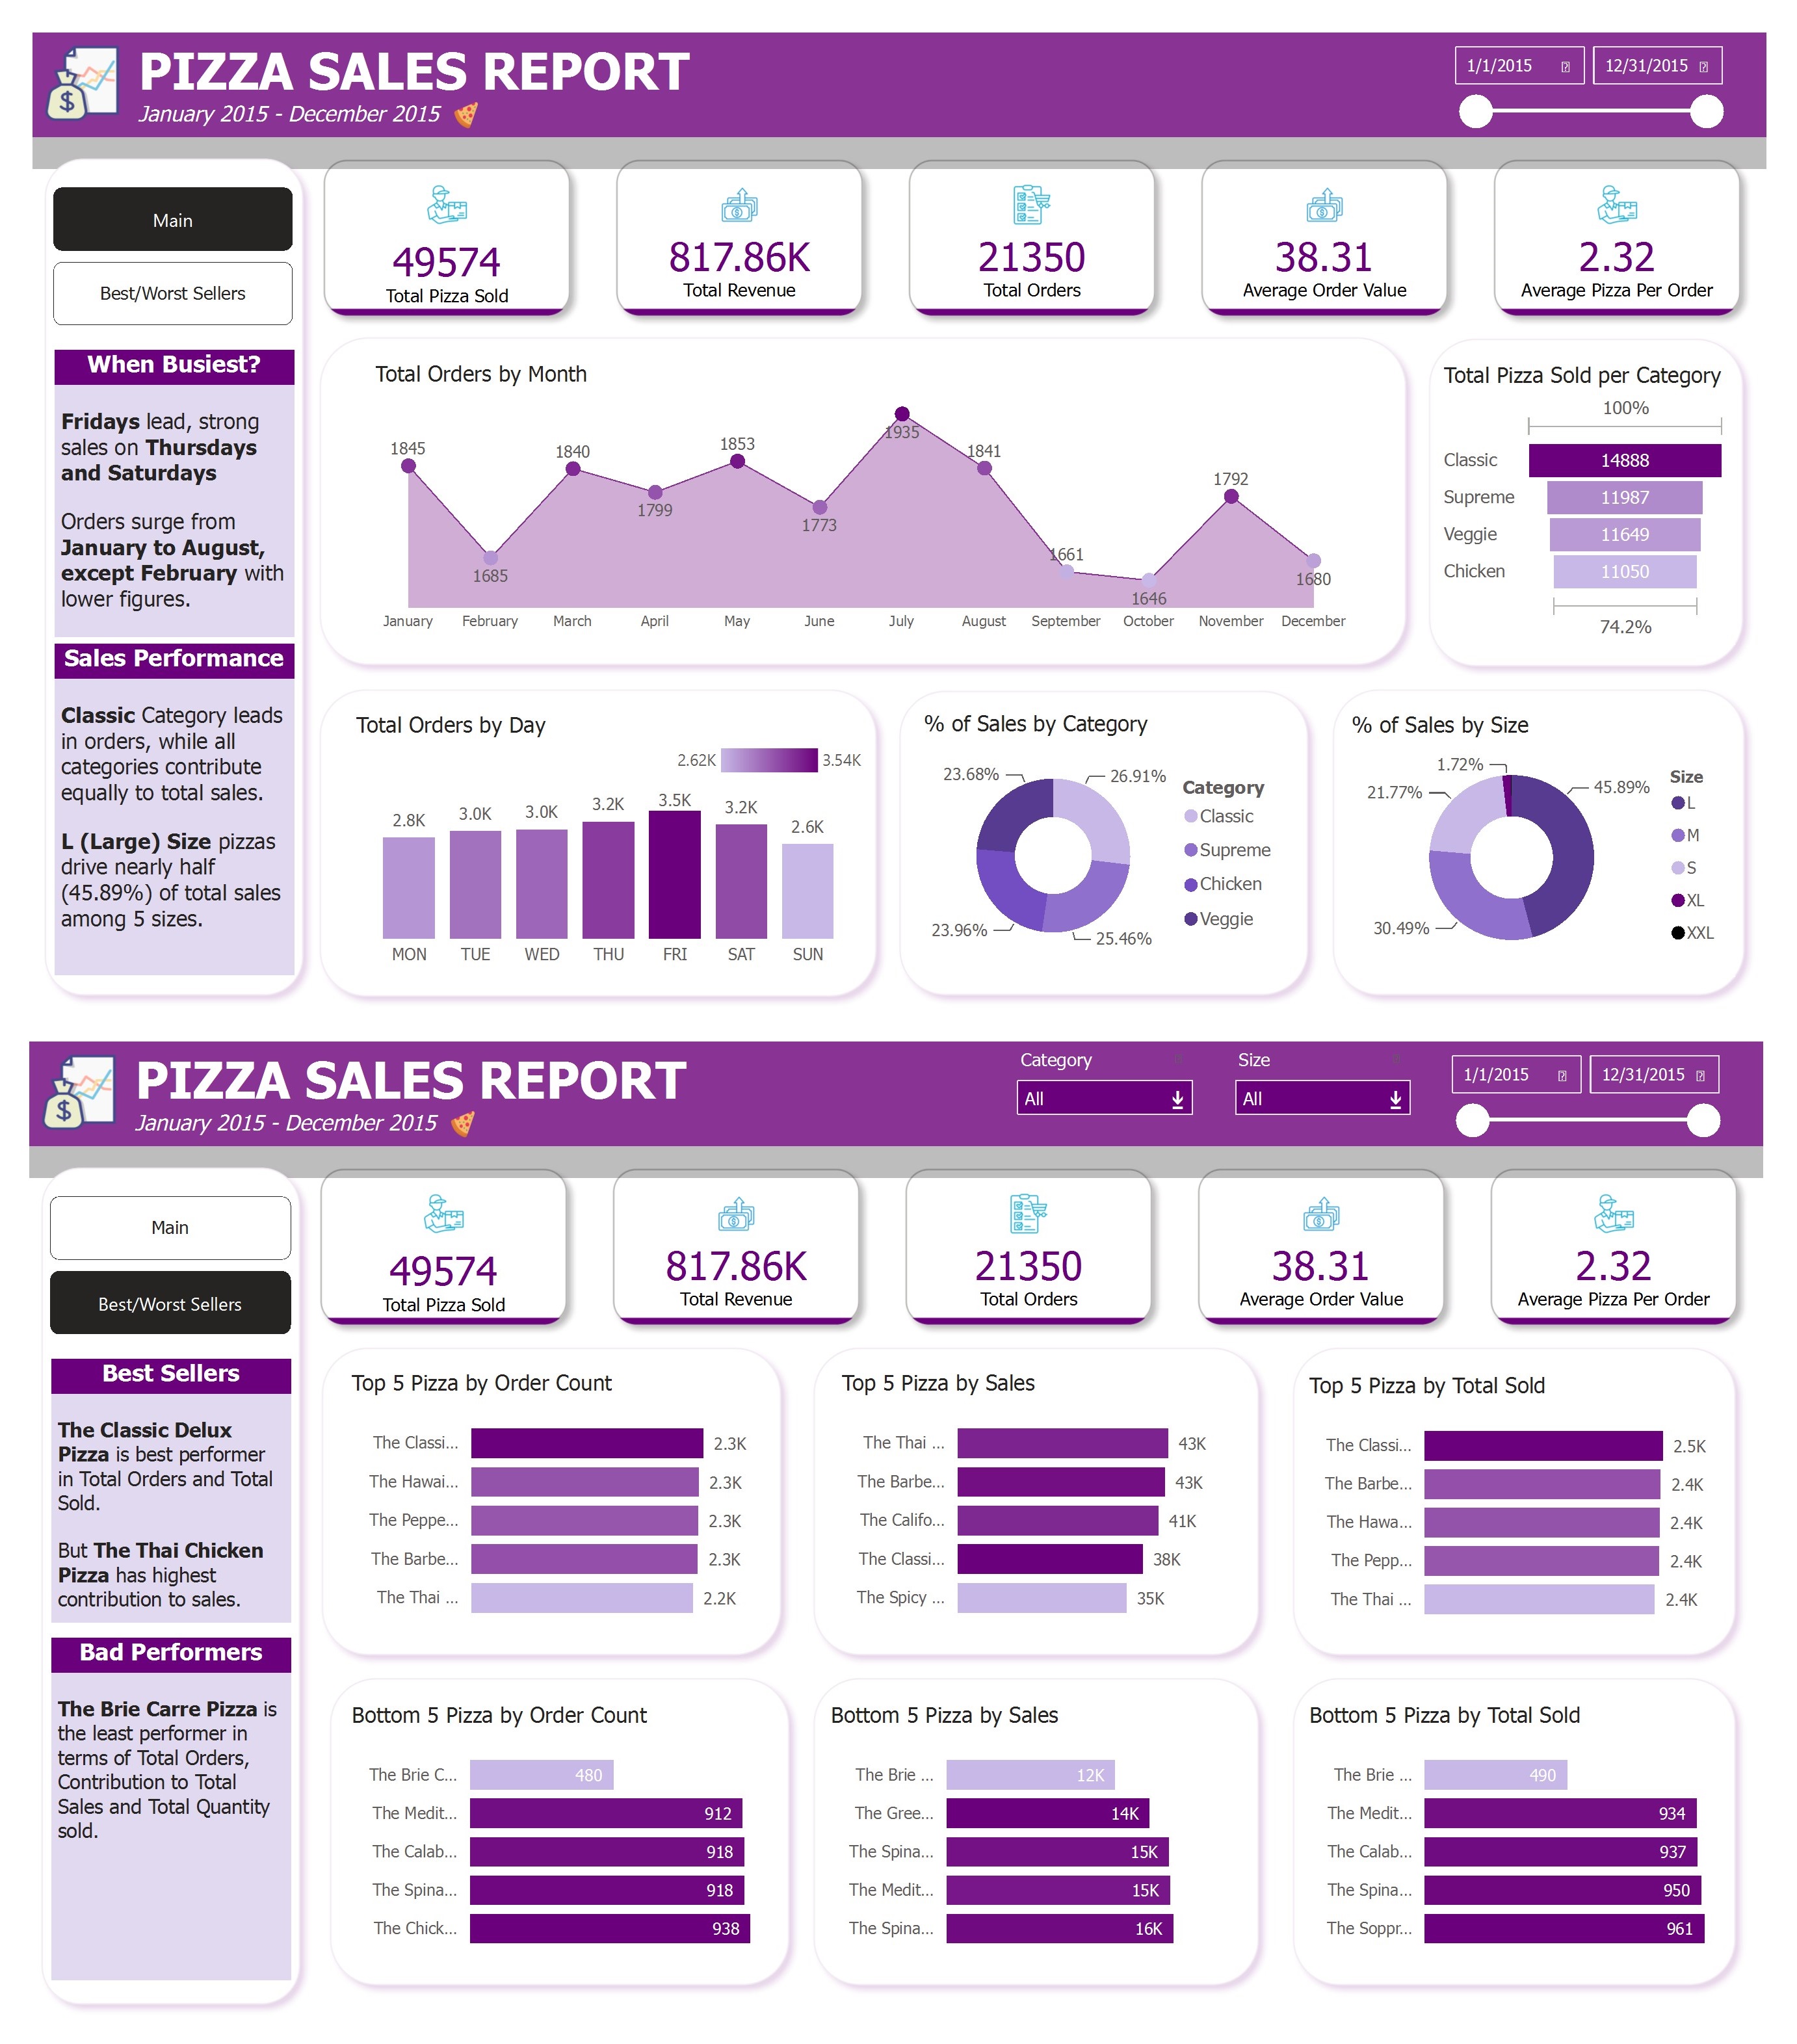
Pizza Sales KPIs & Trends
PostgreSQL & Power BI
Analyzed sales data from January to December 2015, featuring pizzas of various sizes and categories.
Key requirements include KPIs like Total Revenue, Average Order Value, Total Pizzas Sold, and
Charts depicting trends and sales breakdowns. Utilized PostgreSQL and Power BI for analysis and reporting.
Learn more
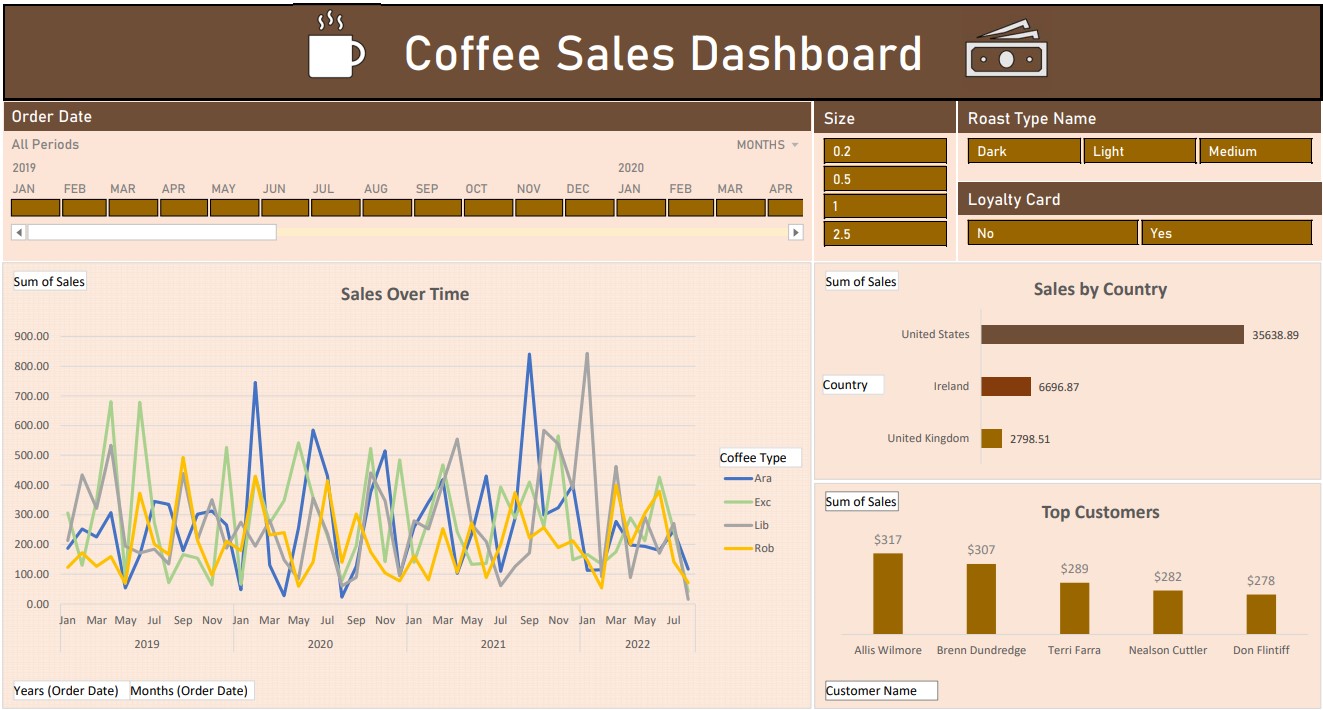
Coffee Sales Dashboard
Microsoft Excel
Created a user-friendly dashboard from a complex dataset containing customer, product, and order information. Key tasks included
leveraging XLOOKUP() and INDEX() MATCH() for data population, employing IF() functions for abbreviation replacement, and
formatting data for consistency. Data management involved removing duplicates and creating a reference table. Data analysis
comprised generating pivot tables and charts to visualize sales trends, top customers, and gross
sales by country. The dashboard featured timeline and slicers for efficient data filtering.
Learn more